Sequim and Port Angeles real estate listings have seen some reductions in prices recently. Realtors love to use euphemisms. Just as a used car is a “pre-owned car,” so a price reduction is a “price improvement!” True from the buyer’s perspective, but certainly not from the seller’s perspective.
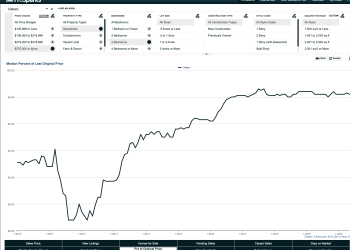
In the last three months, there have been 298 properties (homes and land) in the Sequim area that have had the listing price reduced. In Port Angeles, 220 properties have had a price improvement. Here’s a graphic showing the reductions.

In Sequim listed prices have been reduced in the past three months to about 90.39% of the orginal listed price, and in Port Angeles listed prices have been reduced to about 89.59% of the original listed price. This represents an average price reduction of 9.61% for Sequim properties, and 10.41% for Port Angeles properties.
These are significant reductions, but certainly not the 30% or more that cities like Las Vegas are experiencing. Still this is significant for our area. These numbers are meaningful, because anyone who has their home or land listed for sale must realize that they are not in the driver’s seat to bargain like they were in 2005. This is a buyer’s market. Sellers are not in control, at least not until the market begins to come back stronger.
NOW, do you want to see some actual numbers? Below is a list of 167 listings that have been reduced in price, and I’ve only included the major buyer’s range from $200,000 up to $460,000. Look at the last column to see the actual dollar amount of the reductions. There are many $25,000 reductions, $40,000, $65,000, and up from there. I haven’t included the million dollar home price reductions, because the majority of the buyers are just not there. But if you’re thinking a $5,000 price reduction might move your house, think again. Many have reduced the price 10 times that amount and more.
Read the rest of this post to see the full table of price reductions below.
| List Price | Price Now | DOM | % Reduced | $ Reduction |
| $525,000 | $460,000 | 112 | 12.38% | 65000 |
| $499,999 | $459,000 | 205 | 8.20% | 40999 |
| $529,000 | $455,000 | 448 | 13.99% | 74000 |
| $474,321 | $449,900 | 72 | 5.15% | 24421 |
| $495,000 | $449,000 | 363 | 9.29% | 46000 |
| $485,000 | $449,000 | 168 | 7.42% | 36000 |
| $525,000 | $448,000 | 477 | 14.67% | 77000 |
| $469,000 | $439,000 | 121 | 6.40% | 30000 |
| $425,000 | $435,000 | 104 | -2.35% | -10000 |
| $445,000 | $429,000 | 96 | 3.60% | 16000 |
| $449,900 | $424,900 | 134 | 5.56% | 25000 |
| $499,950 | $419,000 | 560 | 16.19% | 80950 |
| $449,000 | $419,000 | 184 | 6.68% | 30000 |
| $510,000 | $418,000 | 214 | 18.04% | 92000 |
| $429,900 | $415,500 | 46 | 3.35% | 14400 |
| $449,000 | $409,000 | 58 | 8.91% | 40000 |
| $428,900 | $399,950 | 19 | 6.75% | 28950 |
| $424,500 | $399,900 | 117 | 5.80% | 24600 |
| $450,000 | $399,900 | 336 | 11.13% | 50100 |
| $449,500 | $399,900 | 288 | 11.03% | 49600 |
| $425,000 | $399,900 | 26 | 5.91% | 25100 |
| $424,900 | $399,900 | 368 | 5.88% | 25000 |
| $439,000 | $399,900 | 386 | 8.91% | 39100 |
| $409,000 | $399,500 | 77 | 2.32% | 9500 |
| $426,500 | $398,600 | 98 | 6.54% | 27900 |
| $399,900 | $389,900 | 72 | 2.50% | 10000 |
| $479,900 | $389,000 | 520 | 18.94% | 90900 |
| $399,000 | $389,000 | 310 | 2.51% | 10000 |
| $399,999 | $379,999 | 21 | 5.00% | 20000 |
| $399,500 | $379,900 | 209 | 4.91% | 19600 |
| $420,000 | $379,000 | 29 | 9.76% | 41000 |
| $397,700 | $375,000 | 126 | 5.71% | 22700 |
| $399,000 | $375,000 | 115 | 6.02% | 24000 |
| $399,000 | $375,000 | 111 | 6.02% | 24000 |
| $399,500 | $374,000 | 106 | 6.38% | 25500 |
| $399,900 | $372,900 | 309 | 6.75% | 27000 |
| $384,700 | $369,000 | 105 | 4.08% | 15700 |
| $384,500 | $365,000 | 97 | 5.07% | 19500 |
| $449,000 | $365,000 | 283 | 18.71% | 84000 |
| $415,000 | $365,000 | 327 | 12.05% | 50000 |
| $375,000 | $355,000 | 94 | 5.33% | 20000 |
| $399,000 | $350,000 | 767 | 12.28% | 49000 |
| $379,950 | $349,950 | 48 | 7.90% | 30000 |
| $379,000 | $349,950 | 121 | 7.66% | 29050 |
| $365,000 | $349,900 | 331 | 4.14% | 15100 |
| $369,900 | $349,900 | 173 | 5.41% | 20000 |
| $389,000 | $349,500 | 78 | 10.15% | 39500 |
| $389,500 | $349,500 | 43 | 10.27% | 40000 |
| $380,000 | $349,000 | 155 | 8.16% | 31000 |
| $372,000 | $345,000 | 31 | 7.26% | 27000 |
| $415,500 | $344,900 | 54 | 16.99% | 70600 |
| $359,000 | $344,000 | 191 | 4.18% | 15000 |
| $365,000 | $339,900 | 324 | 6.88% | 25100 |
| $359,900 | $339,900 | 54 | 5.56% | 20000 |
| $429,000 | $339,000 | 84 | 20.98% | 90000 |
| $333,650 | $333,650 | 44 | 0.00% | 0 |
| $349,500 | $329,500 | 119 | 5.72% | 20000 |
| $359,000 | $329,000 | 429 | 8.36% | 30000 |
| $349,000 | $329,000 | 69 | 5.73% | 20000 |
| $339,000 | $329,000 | 91 | 2.95% | 10000 |
| $359,000 | $329,000 | 82 | 8.36% | 30000 |
| $365,000 | $325,000 | 120 | 10.96% | 40000 |
| $339,000 | $320,000 | 127 | 5.60% | 19000 |
| $329,950 | $319,950 | 103 | 3.03% | 10000 |
| $335,000 | $318,000 | 211 | 5.07% | 17000 |
| $339,000 | $314,900 | 285 | 7.11% | 24100 |
| $349,900 | $309,900 | 315 | 11.43% | 40000 |
| $329,000 | $309,000 | 103 | 6.08% | 20000 |
| $365,000 | $308,673 | 432 | 15.43% | 56327 |
| $314,900 | $304,900 | 84 | 3.18% | 10000 |
| $335,000 | $300,000 | 148 | 10.45% | 35000 |
| $328,950 | $299,999 | 119 | 8.80% | 28951 |
| $319,900 | $299,950 | 149 | 6.24% | 19950 |
| $364,950 | $299,950 | 415 | 17.81% | 65000 |
| $335,000 | $299,900 | 158 | 10.48% | 35100 |
| $379,000 | $299,900 | 366 | 20.87% | 79100 |
| $369,900 | $299,000 | 126 | 19.17% | 70900 |
| $320,000 | $299,000 | 435 | 6.56% | 21000 |
| $310,000 | $299,000 | 89 | 3.55% | 11000 |
| $309,000 | $299,000 | 134 | 3.24% | 10000 |
| $324,000 | $299,000 | 130 | 7.72% | 25000 |
| $299,000 | $299,000 | 49 | 0.00% | 0 |
| $309,000 | $299,000 | 36 | 3.24% | 10000 |
| $319,000 | $299,000 | 217 | 6.27% | 20000 |
| $305,000 | $298,000 | 78 | 2.30% | 7000 |
| $307,500 | $297,777 | 251 | 3.16% | 9723 |
| $349,500 | $295,000 | 106 | 15.59% | 54500 |
| $314,900 | $295,000 | 134 | 6.32% | 19900 |
| $309,000 | $290,000 | 56 | 6.15% | 19000 |
| $329,000 | $289,900 | 307 | 11.88% | 39100 |
| $319,000 | $289,500 | 194 | 9.25% | 29500 |
| $309,500 | $289,000 | 55 | 6.62% | 20500 |
| $299,000 | $289,000 | 78 | 3.34% | 10000 |
| $319,900 | $287,500 | 46 | 10.13% | 32400 |
| $289,500 | $285,000 | 102 | 1.55% | 4500 |
| $299,900 | $284,900 | 99 | 5.00% | 15000 |
| $287,500 | $279,500 | 63 | 2.78% | 8000 |
| $299,000 | $279,000 | 80 | 6.69% | 20000 |
| $299,500 | $279,000 | 232 | 6.84% | 20500 |
| $299,000 | $279,000 | 80 | 6.69% | 20000 |
| $350,000 | $279,000 | 289 | 20.29% | 71000 |
| $283,900 | $275,000 | 189 | 3.13% | 8900 |
| $319,000 | $275,000 | 124 | 13.79% | 44000 |
| $289,950 | $274,950 | 175 | 5.17% | 15000 |
| $279,500 | $272,500 | 48 | 2.50% | 7000 |
| $312,000 | $272,500 | 125 | 12.66% | 39500 |
| $289,950 | $269,950 | 175 | 6.90% | 20000 |
| $314,950 | $269,900 | 140 | 14.30% | 45050 |
| $350,000 | $269,000 | 282 | 23.14% | 81000 |
| $265,000 | $265,000 | 170 | 0.00% | 0 |
| $280,000 | $265,000 | 84 | 5.36% | 15000 |
| $369,000 | $265,000 | 230 | 28.18% | 104000 |
| $278,900 | $264,500 | 76 | 5.16% | 14400 |
| $269,000 | $264,000 | 57 | 1.86% | 5000 |
| $289,000 | $262,000 | 104 | 9.34% | 27000 |
| $274,900 | $260,900 | 107 | 5.09% | 14000 |
| $289,000 | $259,900 | 174 | 10.07% | 29100 |
| $285,000 | $259,500 | 308 | 8.95% | 25500 |
| $295,000 | $259,000 | 441 | 12.20% | 36000 |
| $274,900 | $259,000 | 79 | 5.78% | 15900 |
| $269,500 | $255,000 | 97 | 5.38% | 14500 |
| $269,000 | $254,000 | 15 | 5.58% | 15000 |
| $275,000 | $250,000 | 164 | 9.09% | 25000 |
| $269,950 | $249,950 | 127 | 7.41% | 20000 |
| $259,000 | $249,900 | 79 | 3.51% | 9100 |
| $255,000 | $249,500 | 133 | 2.16% | 5500 |
| $289,000 | $249,000 | 336 | 13.84% | 40000 |
| $259,900 | $249,000 | 85 | 4.19% | 10900 |
| $255,000 | $249,000 | 50 | 2.35% | 6000 |
| $310,000 | $245,000 | 126 | 20.97% | 65000 |
| $310,000 | $245,000 | 72 | 20.97% | 65000 |
| $260,000 | $245,000 | 83 | 5.77% | 15000 |
| $260,000 | $245,000 | 83 | 5.77% | 15000 |
| $260,000 | $245,000 | 83 | 5.77% | 15000 |
| $265,000 | $243,500 | 202 | 8.11% | 21500 |
| $264,900 | $243,500 | 102 | 8.08% | 21400 |
| $259,900 | $239,900 | 125 | 7.70% | 20000 |
| $249,500 | $239,500 | 100 | 4.01% | 10000 |
| $249,500 | $239,500 | 91 | 4.01% | 10000 |
| $246,000 | $239,450 | 53 | 2.66% | 6550 |
| $263,000 | $239,000 | 95 | 9.13% | 24000 |
| $249,000 | $239,000 | 54 | 4.02% | 10000 |
| $299,000 | $236,000 | 1032 | 21.07% | 63000 |
| $249,500 | $235,000 | 133 | 5.81% | 14500 |
| $237,375 | $234,500 | 129 | 1.21% | 2875 |
| $275,000 | $232,000 | 366 | 15.64% | 43000 |
| $265,000 | $229,999 | 222 | 13.21% | 35001 |
| $239,000 | $229,900 | 183 | 3.81% | 9100 |
| $249,900 | $229,900 | 100 | 8.00% | 20000 |
| $229,900 | $229,000 | 57 | 0.39% | 900 |
| $235,000 | $228,000 | 286 | 2.98% | 7000 |
| $249,000 | $225,000 | 142 | 9.64% | 24000 |
| $213,500 | $221,950 | 64 | -3.96% | -8450 |
| $225,000 | $220,000 | 40 | 2.22% | 5000 |
| $256,000 | $220,000 | 97 | 14.06% | 36000 |
| $269,000 | $220,000 | 202 | 18.22% | 49000 |
| $239,900 | $219,900 | 48 | 8.34% | 20000 |
| $254,900 | $219,900 | 153 | 13.73% | 35000 |
| $224,950 | $214,950 | 84 | 4.45% | 10000 |
| $249,000 | $214,000 | 26 | 14.06% | 35000 |
| $220,000 | $210,000 | 189 | 4.55% | 10000 |
| $250,000 | $209,999 | 222 | 16.00% | 40001 |
| $235,000 | $205,000 | 128 | 12.77% | 30000 |
| $217,500 | $205,000 | 146 | 5.75% | 12500 |
| $224,950 | $204,950 | 36 | 8.89% | 20000 |
| $225,000 | $200,000 | 33 | 11.11% | 25000 |
| $235,000 | $200,000 | 168 | 14.89% | 35000 |
[DOM = Days on Market. Source of data: Olympic Listing Service]
Last Updated on August 6, 2008 by Chuck Marunde