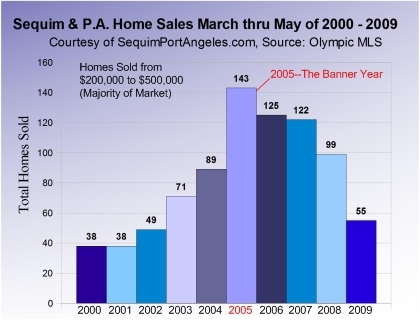
Home sales in Sequim and Port Angeles from 2000 to 2009 for March, April, and May are shown in this graphic. Of course 2005 was the banner year for sales here, as it was in many parts of the country, and 2009 shows us that only 55 homes sold in this three month period. I’ve weighted the chart for better accuracy by eliminating houses sold outside the bell curve, because the vast majority of homes sold in Sequim and Port Angeles are within the price range of $200,000 to $500,000.
What isn’t showing up in this chart for 2009 is the burst of buyer activity for homes that are currently under contract but not yet sold (closed), which means they won’t show up in the data for another one to three months. There has been a burst of buyer activity here in this three month period. Buyers are motivated by low interest rates as well as bargains in the inventory.
Last Updated on June 6, 2009 by Chuck Marunde


Thanks a lot for a great information. I am just still confused since some data shows it is really the bottom now and some says not yet. Personally, I hope that the house price stays low at least 1 year so that I can buy a house! =)