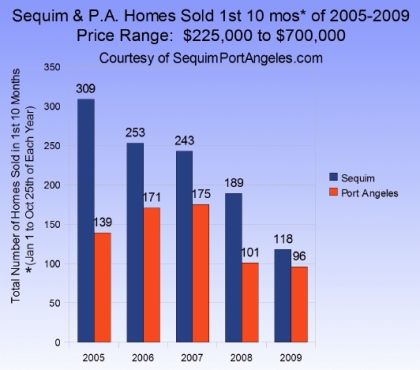
Sequim home sales have picked up recently in the last couple of months, as they have around many parts of the country, but this chart helps put things into a long term perspective. This chart represents Sequim home sales compared to Port Angeles home sales for the first 10 months of 2009 (specifically Jan. 1 to Oct. 25).
Sequim was the big winner in 2005 for the first 10 months with sales of 309 homes, and Port Angeles lagged behind with only 139 homes sold. These are single family site-built homes only. Not included are multi-family, condos, and mobile homes.
Sequim home sales began a downward slide from its peak year of 2005 to today, and Port Angeles peaked in 2007 with 175 homes sold. I find it interesting that while Sequim’s sales are down to 118 thus far this year, Port Angeles seems to have a safety net at about 100. Last year was at 101 and this year so far Port Angeles home sales are at 96.
While we are still waiting patiently for a good long-term indication of strong growth in home sales and in home building, I have noticed a short-term increase in sales of existing homes and lots. That has brought our current numbers up substantially, or Sequim and Port Angeles would have both been substantially below 118 and 96, respectively.
In my opinion Sequim has seen the bottom of this chart and sales will level and begin to move upward over the next year. Port Angeles is harder to predict. I think Port Angeles could see Sequim take some of its sales away, and Port Angeles may struggle to develop any kind of significant upward trend on a chart like this. I think the Port Angeles economy will have to see some strong underlying movement to push the real estate market a bit.
Sequim Home Sales Report courtesy of Chuck Marunde, J.D.
Last Updated on July 27, 2012 by Chuck Marunde


