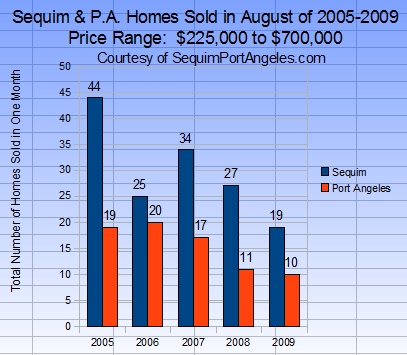
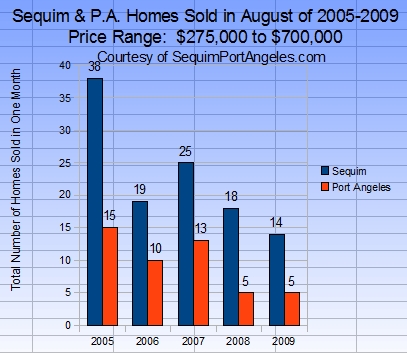
Here’s a vignette of Sequim home sales in the month of August in each year from 2005 through 2009 for both Sequim and Port Angeles. There are two graphs here. The first one includes homes from $225,000 to $700,000, and the second graph narrowed the range slightly to include homes from $275,000 to $700,000.
Notice the difference. The difference is slight but revealing. See if you can interpret the reason for the difference, especially in August of 2009.
The difference that hit me as I studied the data is how the Sequim and Port Angeles real estate markets are different. Prices of homes are higher in Sequim, so in the second chart we see a greater number of homes sold in Sequim in the month of August compared to Port Angeles. In the first graph Sequim sold almost twice as many as Port Angeles, but in the second graph Sequim sold almost three times as many when we increased the selling price by $50,000 on the bottom end.
Is this a trend? I believe it is. Sequim is simply becoming more and more popular, especially for retirees.
Last Updated on September 10, 2009 by Chuck Marunde


