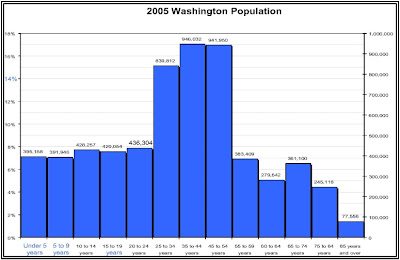
The age distribution of our population is changing: the elderly segment of the population is increasing. This is due to two factors: increasing longevity and the aging of a large population cohort (e.g., the baby boom and baby boom echo). A person born in 1905 had a life expectancy at birth of 48.7 years (47.3 for men and 50.2 for women). A person who was aged 70 in 2005 would have already outlived the average at birth life expectancy of 61.7 years (59.9 men and 63.9 for women); and a person born in 2000 has a life expectancy of 77.0 years (74.3 for men and 79.7 for women).
Click on graphic for enlarged view.

Not only are people living longer, but for certain age groups, there are actually more of them. In the post World War II period (1946-1954) the US experienced a large increase in the birthrate, known as the “Baby Boom.†This group is now aged 50-60 and will entering retirement soon. There was drop-off in birth rates after 1954, but a large number of babies were still born in the 1955-1964 period, these individuals now aged 42-51 represent the trailing edge of the baby-boom2. When the baby-boomers began to have children, this created another spike in birthrates beginning in the 1980’s known as the baby-boom echo.
The result of these age demographics is that the estimated median age in Washington state is 36.7 years ( ±0.2 Years) compared with the United States estimate of 36.4 years ( ±0.2). The number residents of Washington State over 65 is growing rapidly. U.S. Census figures indicate a 15.1 percent increase between 1990 and 2000 compared with 12.0 percent nationwide. The Western region of the country generally saw the most rapid growth in the senior population. The state of Washington had the 20th most rapid percentage growth during the 1990s, but only 12 states actually added more seniors during the decade.
[Source: Washington Center for Real Estate Research, Housing Washington’s Seniors]
Last Updated on May 9, 2024 by Chuck Marunde


